The Covid-19 pandemic has posed significant challenges to parliaments around the world (Bar-Siman-Tov 2020). Parliaments have faced both political and operational challenges. The former has seen a sharp increase in executive rule-making powers in response to the pandemic that has challenged the influence and oversight powers of parliaments. While for the latter, parliaments have faced closures and suspensions as the pandemic struck. This paper starts from the point that the continued representation of citizens in parliament by legislators is essential for well-functioning countries during times of crisis. As such, lessons should be learned about how and why some parliaments were able to continue to operate throughout the pandemic, while others were closed for often lengthy periods.
However, surprisingly little has been written about the factors associated with whether a parliament closed due to Covid-19, or how long closures lasted in those parliaments that ceased to operate. In this paper, I use data mined from qualitative reports written for the Lex-Atlas: Covid-19 (LAC19) project to examine relationships between a country’s system type, degree of freedom, adherence to the rule of law and income inequality and the likelihood and/or length of parliamentary closures due to the pandemic. Prior to outlining these analyses, I will first discuss the LAC19 project and how the dataset used in this paper was developed.
LAC19 – The project and production of data
The LAC19 project was the brainchild of Professors Jeff King (UCL) and Octávio Ferraz (KCL) in 2020. The goal of LAC19 has been to track the legal and political responses to Covid-19 in around 70 countries through a series of reports written by country experts. These reports, averaging over 20,000 words, are written in adherence to a set Author Guidance Code (AGC). The AGC details both a set of questions that country authors must answer and the structure the report should take. Once submitted, the reports are subjected to a robust and multi-stage editing process by the Editorial Committee to ensure the structure and content of a report meet with the AGC. The design of this process ensures that the reports are not only comprehensive in their coverage, but that they offer the potential to make cross-country comparisons on the topics covered.
Despite the value of the reports for comparative study of national responses to the pandemic, the editorial committee recognised early on that the length of the reports presented a barrier to their use for such purposes beyond legal disciplines. It was decided to apply data mining techniques to produce a series of more manageable datasets. These datasets primarily seek to present information in a more simplified quantitative format, but also contain contextual and descriptive information in a qualitative format. Importantly, hyperlinks are included in the datasets that take the user to the relevant section of the country reports from which information is taken. The aim here is to improve the useability of the resource for the widest possible audience both for academic research and for use by policymaking practitioners. Presently, datasets have been completed on the emergency powers used to tackle the pandemic, the response of parliaments, and federalism - all of which will be made public in the coming weeks. Below I focus on data collected from country reports on whether a parliament closed and the length of any closures.
The closure of parliaments in 39 countries
As things stand, the LAC19 Parliaments dataset contains 39 countries. These countries, along with whether their parliament was closed or suspended in response to Covid-19, can be found in Table 1. We find that 23 of the 39 (59%) of the parliaments in our sample remained open during the pandemic. While this shows the descriptive value of the LAC19 data, the opportunity to link data to external dataset sources offers greater analytical opportunities.
Table 1: The countries included in the LAC19 Parliaments dataset and whether the Parliament was closed/suspended or remained open

System type and closures
Information on system type, provided by IPU Parline, means we can see if patterns of parliamentary closures were influenced by systemic factors. Figure 1 shows an alluvial plot where the different system types on the left axis flow to whether their parliament was closed or suspended on the right axis.[1] What this analysis shows is that system type has no demonstrable effect on whether a parliament is likely to remain open or closed. Thirteen of the 21 (62%) parliaments in parliamentary system remained open while five of the eight (63%) parliaments in each of the presidential and semi-presidential systems remained open.
Figure 1: Alluvial plot showing whether parliaments were closed or remained open for different system types

Freedom, rule of law, and income inequality
Whether a parliament was closed or not provides a binary ‘yes/no’ variable which can be modelled using a logistic regression. This analysis returns a probability of an event occurring (in this case a parliament closing due to Covid-19) given one or more explanatory variables. Here I run three bivariate (using just one explanatory variable to model whether a parliament was closed) logistic regressions. The first, shown in Figure 2, examines the relationship between the Freedom Score of a country and parliamentary closure. The Freedom Score is a measure of the degree of civil liberties and political rights provided by Freedom House, a US-based non-governmental organization. Scores range from 0 for a country that has no freedoms and 100 for a country that is completely free. To avoid measuring any effect on the score caused by the response to the pandemic, the 2019 scores for countries were used in the analysis. This also applies to the rule of law and inequality measures to follow. The range of scores in the LAC19 sample of 39 countries runs from 9 for China, to 100 for Finland, Norway, and Sweden.
The analysis shows a moderate negative correlation between Freedom Score and the probability of a country’s parliament having been closed due to Covid-19. That is, as countries become freer, the likelihood of the parliament having been closed falls. Across the LAC19 sample, the probability of parliamentary closure falls from around 63% for a country with the same Freedom Score as China, to around 35% for countries with freedoms like Finland, Norway, and Sweden.
Figure 2: Plot showing the results of a bivariate logistic regression modelling the effect of Freedom Score on the probability of a country’s parliament remaining open

The second analysis uses the World Justice Project’s Rule of Law Index score. The Index measures across eight dimensions to provide an estimate of how the rule of law is experienced in different countries. Scores run from zero for countries in which there is no experience of the rule of law to 1.0 where the experience of the rule of law is perfect. The range of scores is more limited than the Freedom Score, with Rule of Law Index scores in the LAC19 sample ranging from 0.39 to 0.89. The result of the analysis is shown in Figure 3.
As with the Freedom Score analysis, the relationship between the Rule of Law Index score and the probability of parliamentary closure because of the pandemic is negative. Simply put, as adherence to the rule of law in a country increases then the probability of parliament having been closed falls. This effect, however, is more substantive than the Freedom Score measure. Even given the more limited range of scores, the probability of parliament having been closed falls from 63% for countries at the lower range of scores to 35% at the higher range.
Figure 3: Plot showing the results of a bivariate logistic regression modelling the effect of the Rule of Law Index score on the probability of a country’s parliament remaining open

The final analysis of whether parliaments closed examines the effect of inequality on the closure of parliaments during the pandemic. The accepted quantitative measure of inequality is the Gini coefficient calculated by the World Bank and which measures the income inequality in a country. A country with a perfectly equal distribution of income would be assigned a score of zero while a country in which just one person had all the income would be assigned 100. The range of scores in the LAC19 sample runs from 27.2 for the most equal country (Belgium) to 53.4 for the most unequal (Brazil). The analysis is shown in Figure 4.
The relationship between income inequality and the probability of parliament having been closed is moderately positive. As income inequality increases, the likelihood that parliament has been closed due to Covid-19 increases. A country with similar income inequality to Belgium is predicted to have a 24% chance of having seen parliament closed. This rises to nearly 75% for a country with a similar income inequality as Brazil (although Brazil itself did not see its parliament close during the pandemic).
Figure 4: Plot showing the results of a bivariate logistic regression modelling the effect of income inequality on the probability of a country’s parliament remaining open

Summary
Modelling the likelihood of parliaments having been closed due to the pandemic shows some interesting trends. Proponents of greater freedoms, the rule of law, and increased income equality have long stated that positive policy outcomes will follow from improvements in those areas, and they will be pleased by the results outlined above. There is evidence that parliaments in countries with greater freedoms, greater adherence to the rule of law, and greater income equality were more likely to remain open.
The analysis, partially conducted to display the capabilities of the LAC19 data, is limited, but clear trends for all three explanatory variables suggest a link between attributes widely viewed as positive and an ability for citizens to continue to be represented in parliament during a period where important, and often controversial, policy decisions were being made. Further analysis of these factors is essential if we are to understand how to keep parliaments open and operational in future crises. Having analysed some explanations of why parliaments closed, I will now turn my focus to the parliaments that did close as a result of Covid-19.
Parliaments that closed: why did the lengths of closure differ?
As detailed above, differing factors seemed to influence the likelihood of a parliament closing during the pandemic. In the second part of the paper, I turn my attention to the 16 parliaments that did close. The granularity of the LAC19 data allows the length of parliamentary closures to be calculated. Now, this is not as easy as it might initially sound. Differences in how and when parliaments meet make calculations difficult, as does accounting for pre-planned breaks in parliamentary activities. For example, the National People's Congress in China meets very rarely, and the UK Parliament’s closure spanned over a period of recess. However, for the ease of this analysis, I calculate the number of days a parliament was closed from the first day it should have met to the day it reopened after closure.
The number of days that the 16 parliaments in the LAC19 sample closed for is shown in Figure 5. We can see that the number of days of closure ranges from seven while the Legislative Assembly of Costa Rica decamped to a nearby museum to the 194 days that the Canadian Parliament remained closed. Below I will run bivariate analyses of the length of parliamentary closures using the same three explanatory variables I used in the analysis above. Unlike with the binary ‘yes/no’ variable indicating whether a parliament closed or not, both variables in these analyses are continuous. This means that I can use a simple linear regression model which plots a trend line on a scatter plot. The first analysis uses the Freedom House Freedom Score and is shown in Figure 6.
Figure 5: Number of days parliaments were closed for due to Covid-19

Figure 6: Plot showing the correlation between the number of days a parliament was closed and a country’s Freedom Score

Figure 6 shows a moderate negative correlation with a higher Freedom Score being associated with fewer days of parliamentary closure. What is evident, however, is that Canada (very top right of the plot) is a significant outlier. With a very high Freedom Score of 98, yet a total of 194 days of parliamentary closure, Canada is positioned a long way from the trend line. As a result, I ran the analysis again with Canada removed and this is shown in Figure 7.
The result is quite remarkable. The correlation becomes strongly negative with a clear relationship between higher Freedom Scores and the number of days parliaments were closed. Indeed, a country with a Freedom Score like China and which had seen its parliament closed due to Covid-19 would expect that parliament to remain closed for over 100 days. Conversely, this number drops to around just 20 for the countries with the highest Freedom Scores.
Figure 7: Plot showing the correlation between the number of days a parliament was closed and a country’s Freedom Score with Canada removed
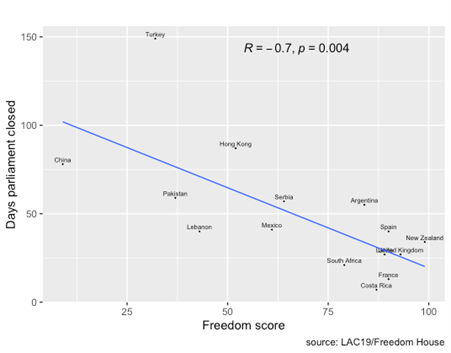
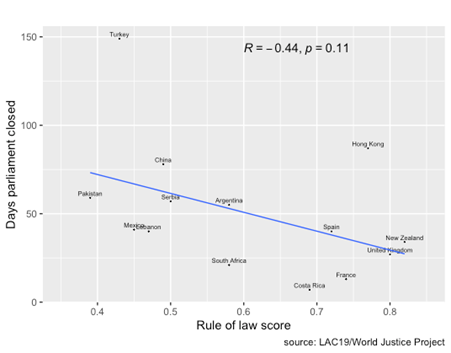
Figure 8 shows the correlation between the Rule of Law Index score and the number of days parliaments were closed. The analysis shows that there is no relationship between the two variables. Yet once again, Canada is an obvious outlier. Running the analysis in the absence of Canada (Figure 9) again shows a strengthening of the negative relationship. While not as dramatic a change as with the Freedom Score analysis, once Canada is removed there is a clear correlation between greater adherence to the rule of law and shorter periods of parliamentary closure due to the pandemic.
Figure 8: Plot showing the correlation between the number of days a parliament was closed and a country’s Rule of Law Index score
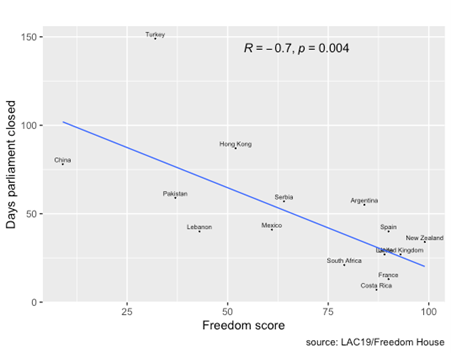
Figure 9: Plot showing the correlation between the number of days a parliament was closed and a country’s Rule of Law Index score with Canada removed
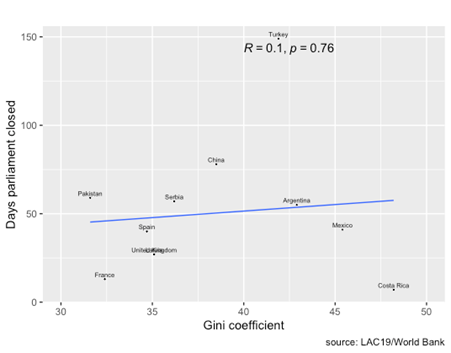
The final analysis includes the Gini coefficient that measures income inequality. As might be expected at this stage, I run the analysis twice with Canada included in Figure 10 and excluded in Figure 11. Figure 10 shows a weak negative correlation between income inequality and the number of days parliament remained closed, with greater inequality associated with slightly shorter closures. But Canada with relatively low-income inequality and a high number of days during which its parliament was closed is again a clear outlier. Removing Canada in Figure 11 sees the direction of the effect of income inequality reverse with greater inequality being associated with longer periods of closure in the absence of Canada. It must be noted here however, that income inequality is a poor predictor of the number of days parliaments remained closed due to the pandemic.
Figure 10: Plot showing the correlation between the number of days a parliament was closed and a country’s income inequality
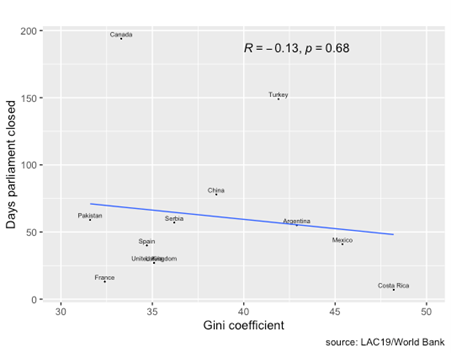
Figure 11: Plot showing the correlation between the number of days a parliament was closed and a country’s income inequality without Canada
Summary
It will hardly come as a surprise to you at this point that Canada represents a deeply problematic case for the comparative analysis of parliamentary closures during the pandemic. Although beyond the scope of this paper, a case study of Canada is needed to determine the additional factors that led to such a long period of closure in a country that is very free, adheres closely to the rule of law and has relatively high-income equality. The value of the LAC19 resource is that this is exactly the sort of work that can be conducted. Preliminary analysis using the quantitative data can then lead to a deeper analysis using the 20,000-plus word report which then, in turn, can guide further quantitative analysis. The opportunity to conduct this kind of work makes LAC19 unique as a Covid-19 resource.
Away from the self-congratulation though, the analysis of the number of days during which parliaments were closed during the pandemic shows a very strong relationship between low levels of freedom in a country and longer parliamentary closures. This doesn’t seem to extend to the rule of law in the same way as the analysis in the first half of the paper, and income inequality appears to be a poor predictor of how long parliaments were closed. Why more authoritarian countries had longer periods of closure raises interesting questions. For example, is it that the executives in more authoritarian states can impose their will versus parliaments? Or is it that weaker parliaments in such systems are less interested in attempting to meet because of weaker electoral incentives? I hope that these are the sorts of questions, amongst others, that you will want to explore using the LAC19 resource.
[1] Note that IPU Parline does not offer a system type for Hong Kong which explains why the number of countries total just 38.
TWEET
